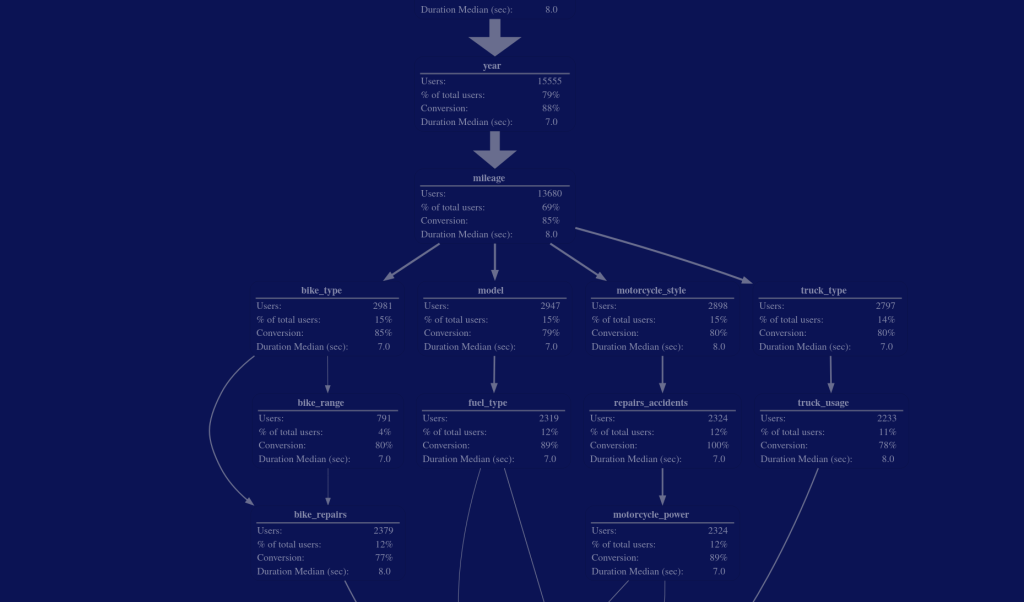
Visualizing Conditional User Journeys with Funnelius
At PyData Berlin 2025, I had the chance of introducing a Python library I developed called Funnelius. It’s designed to tackle a common but tricky problem in data analysis: visualizing complex, non-linear user journeys. If you’ve ever found yourself struggling to analyze non-linear conditional funnels or make sense of a “spaghetti” Sankey chart, this is […]
Visualizing Conditional User Journeys with Funnelius Read More »