
I am Yaseen Esmaeelpour
I’m a Data Analytics Consultant in Berlin with 10 years of experience helping tech, startups, and supply chain companies.
I help businesses:
- Make faster, data-driven decisions
- Build reliable data pipelines and dashboards
- Run experiments to learn and improve quickly
- Find and fix performance problems
Need help with your analytics? Let’s talk.
My Tech Stack
#Yaseen's tech stack
spreadsheets = ['Excel', 'VBA', 'PowerPivot', 'Google Sheets']
dtabases = ['SQL Server', 'MySQL', 'Redshift']
business_intelligence = ['Power BI', 'Looker', 'Qlik']
python_libraries = ['Matplotlib', 'NumPy', 'Pandas', 'Polars',  'streamlit',  'Scrapy', 'Sci-kit learn', 'nltk', 'prophet', 'pycausalimpact', 'hdbscan', ]
other_tools = ['Jupyter Lab', 'DBT Cloud', 'SSIS', 'Google Analytics', 'SAP', 'MixPanel', 'salesforce']
Portfolio
Blog posts
- Should you include a picture in your resume when applying for a job in Germany?
 Should you put a picture on your resume or not? This is a question many of us who have come to Germany as migrants often ask ourselves. Here’s my two cents to answer this question
 - Visualizing Conditional User Journeys with Funnelius
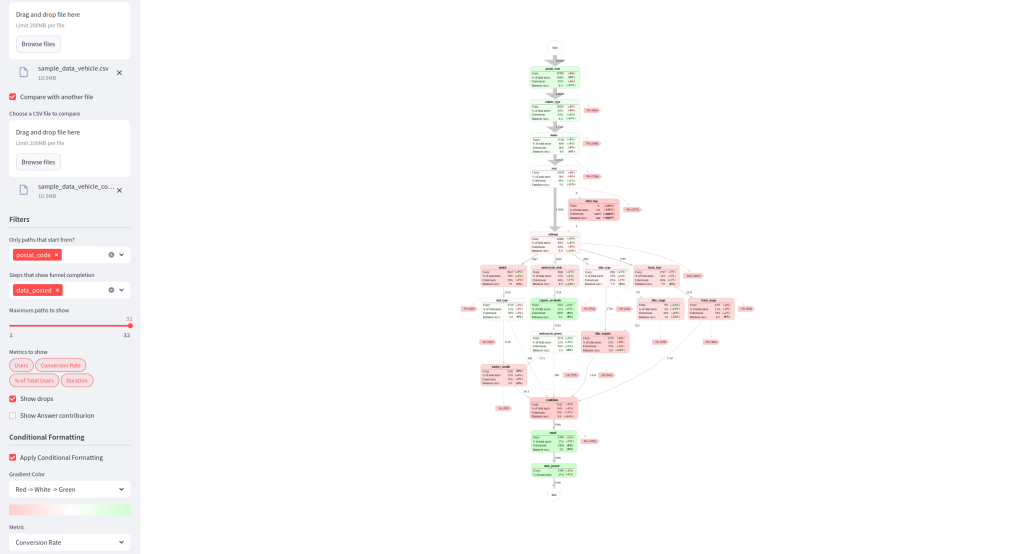
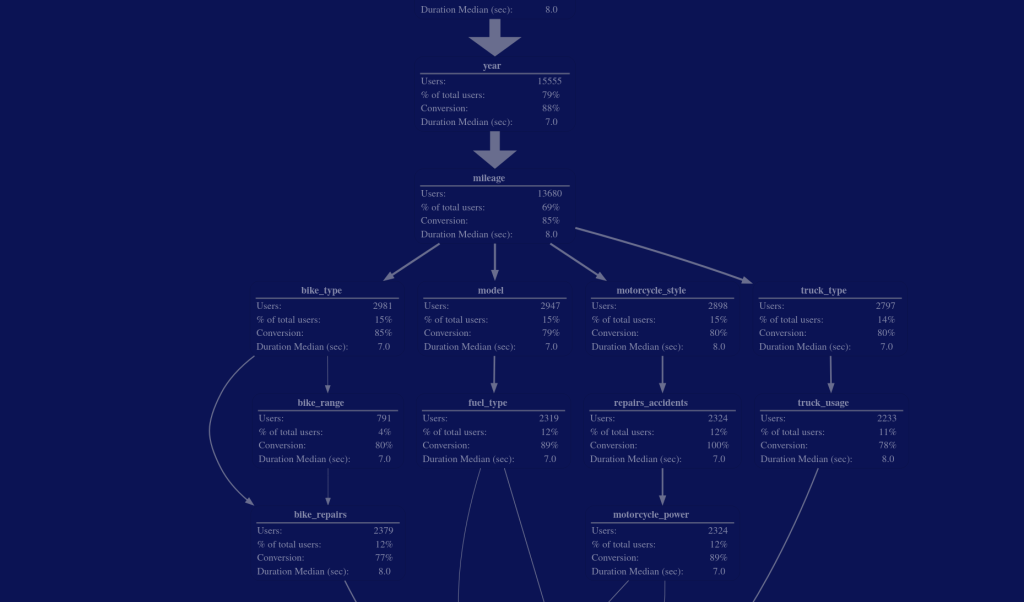 At PyData Berlin 2025, I had the chance of introducing a Python library I developed called Funnelius. It’s designed to tackle a common but tricky problem in data analysis: visualizing complex, non-linear user journeys. If you’ve ever found yourself struggling to analyze non-linear conditional funnels or make sense of a… Read more: Visualizing Conditional User Journeys with Funnelius
 - Is pursuing higher data quality always the best approach?
 As a data analyst, we all read articles stressing the importance of data quality, and it absolutely is crucial. But there’s another side to the story: achieving perfect data can be expensive and time-consuming. If your data is already 99% accurate, is it worth the extra effort to squeeze out… Read more: Is pursuing higher data quality always the best approach?
 - How to do CausalImpact analysis in python using pycausalimpact
 Making choices is a big part of business, but how do you know if your decisions are actually improving things? Ideally, you’d run controlled experiments, but that’s not always possible. This post explores CausalImpact, a powerful tool that helps you estimate the impact of decisions on your data, even when experiments aren’t an option. It works by creating a counterfactual scenario – what would have happened if you hadn’t made the decision? – and comparing it to the actual results.